Distributed Tracing for Autonomous Agent Pipelines
Agents need tracing built for semantic failures, not just crashes.
A production agent can return a healthy 200 response while being completely wrong underneath. That single fact breaks the core assumption traditional monitoring was built on, and it's the reason distributed tracing for agent pipelines needs its own engineering discipline, not a bigger dashboard.
Why traditional distributed tracing breaks on agent pipelines
Traditional APM rests on three assumptions: the same input produces the same output, every call follows a known code path, and a 200 response means the system is working. Agents break all three at once. The same agent asked the same question twice can call different tools, in a different order, with different arguments. The path through the system is decided, turn by turn, by whatever the model outputs.
That third assumption is the one that causes the most damage. A 200 response can wrap a confidently wrong answer: an agent that loops, calls the wrong tool, or hallucinates a result can still return 200 within normal latency, and the APM dashboard reports a healthy system the entire time. Nothing throws an exception. Nothing gets logged as an error. The failure is semantic, and traditional tooling was never built to catch semantic failure.
Picture the actual failure mode. A tool call early in the pipeline returns data that's subtly wrong, not malformed, just off. Several steps later, an agent downstream produces a wrong final answer built on that bad data. No exception fires anywhere along the chain. The dashboard stays green from start to finish. The only way to catch this after the fact is to walk the causal chain span by span, and traditional APM wasn't built to preserve that chain across model-driven branching.
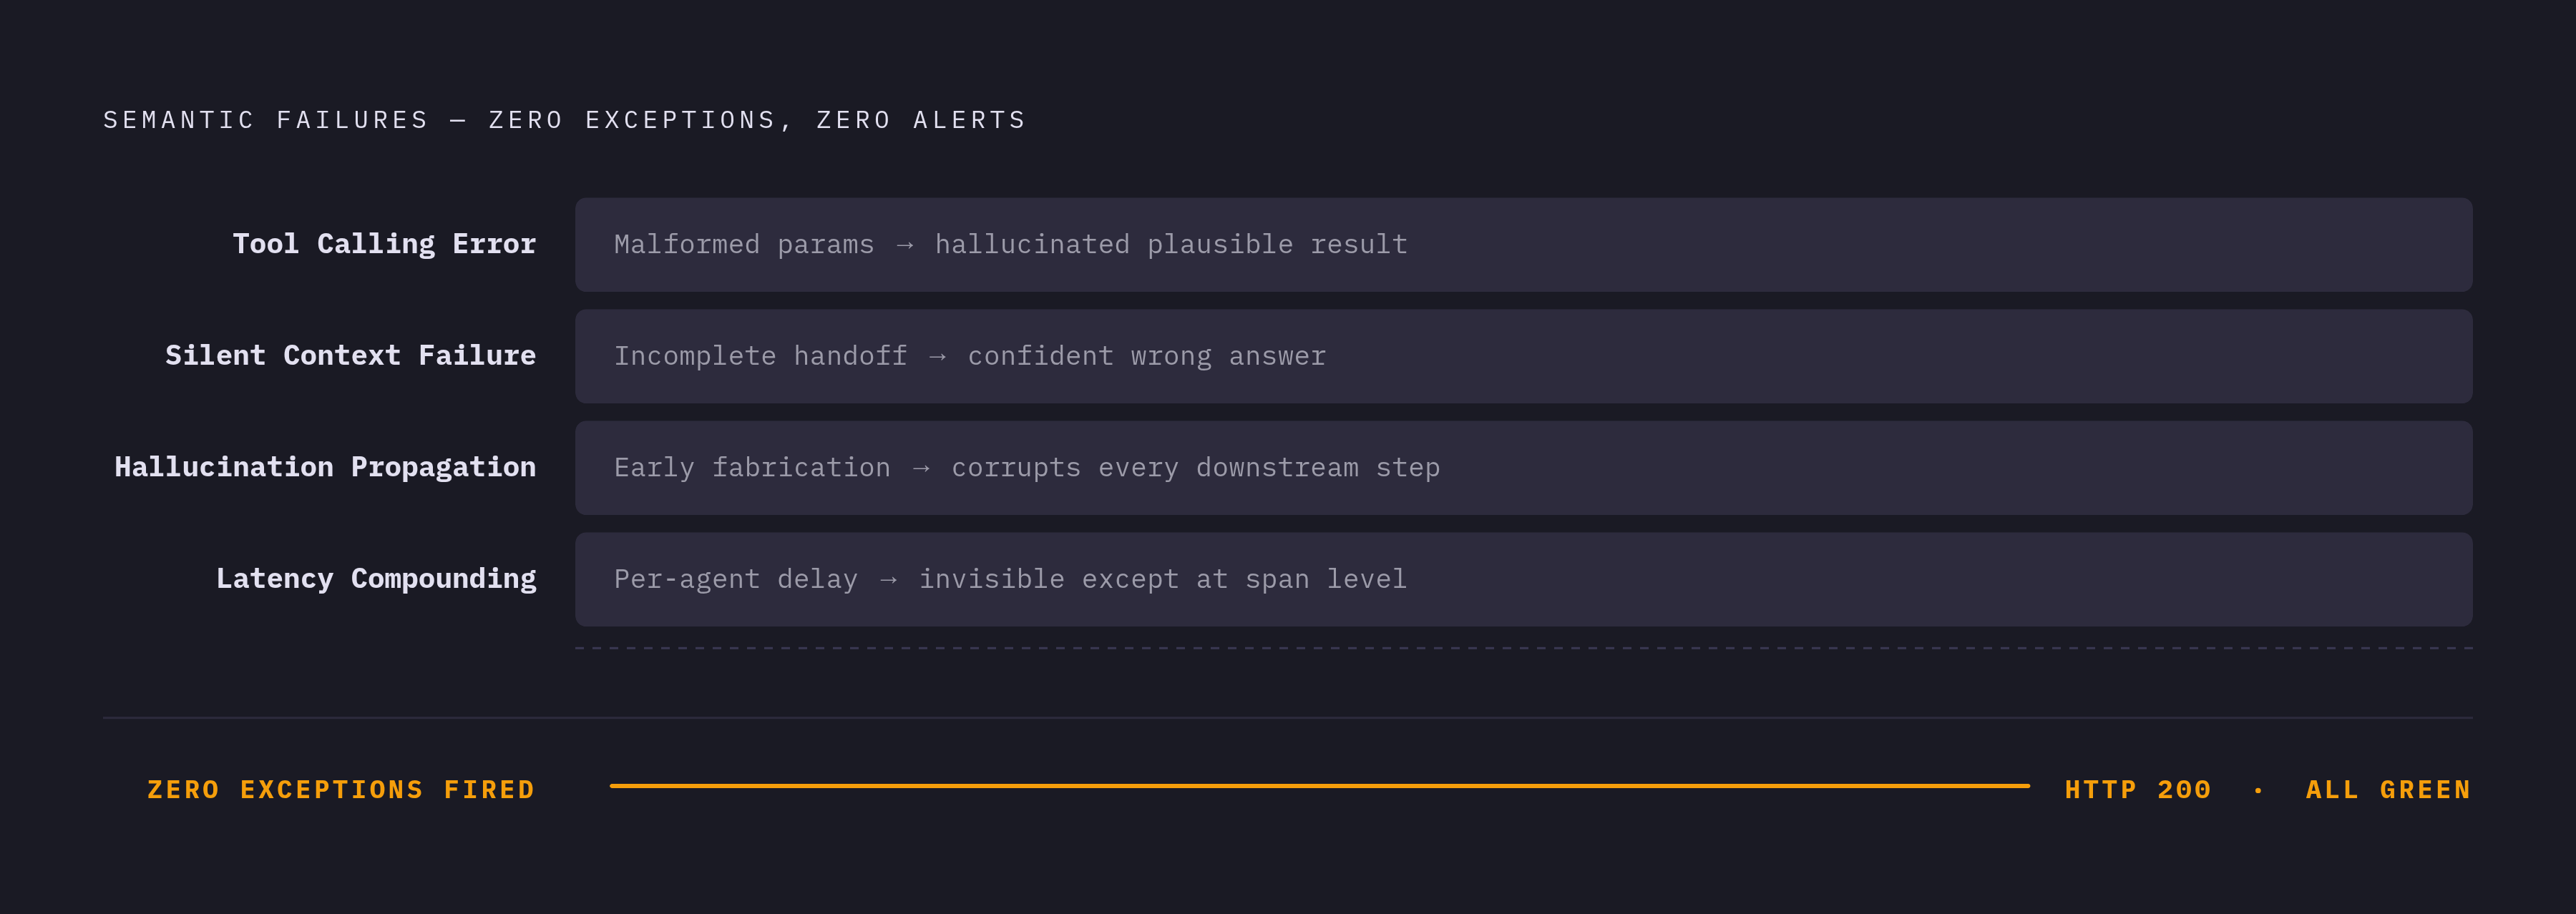
Four specific failure categories fall into this blind spot. If malformed parameters cause the agent to hallucinate a plausible-looking result instead of surfacing an error, that's a tool calling error. If one agent hands incomplete context to the next, the second agent still answers confidently, just wrong, and that's a silent context failure. Hallucination propagation happens when a fabrication introduced early in the chain corrupts every step after it, with no exception anywhere to flag it. Latency compounding happens when each agent in a chain adds a little delay, delay that appears as a problem only when measured at the span level rather than in a single end-to-end number. These failures produce no errors. All four require instrumentation built for a system where "it ran without crashing" and "it worked correctly" are two completely different claims.
The four tracing primitives agents carry over, and what agents add on top
OpenTelemetry still gives the right starting vocabulary for this problem, but agents need more structure layered on top of it. Four primitives carry over directly.
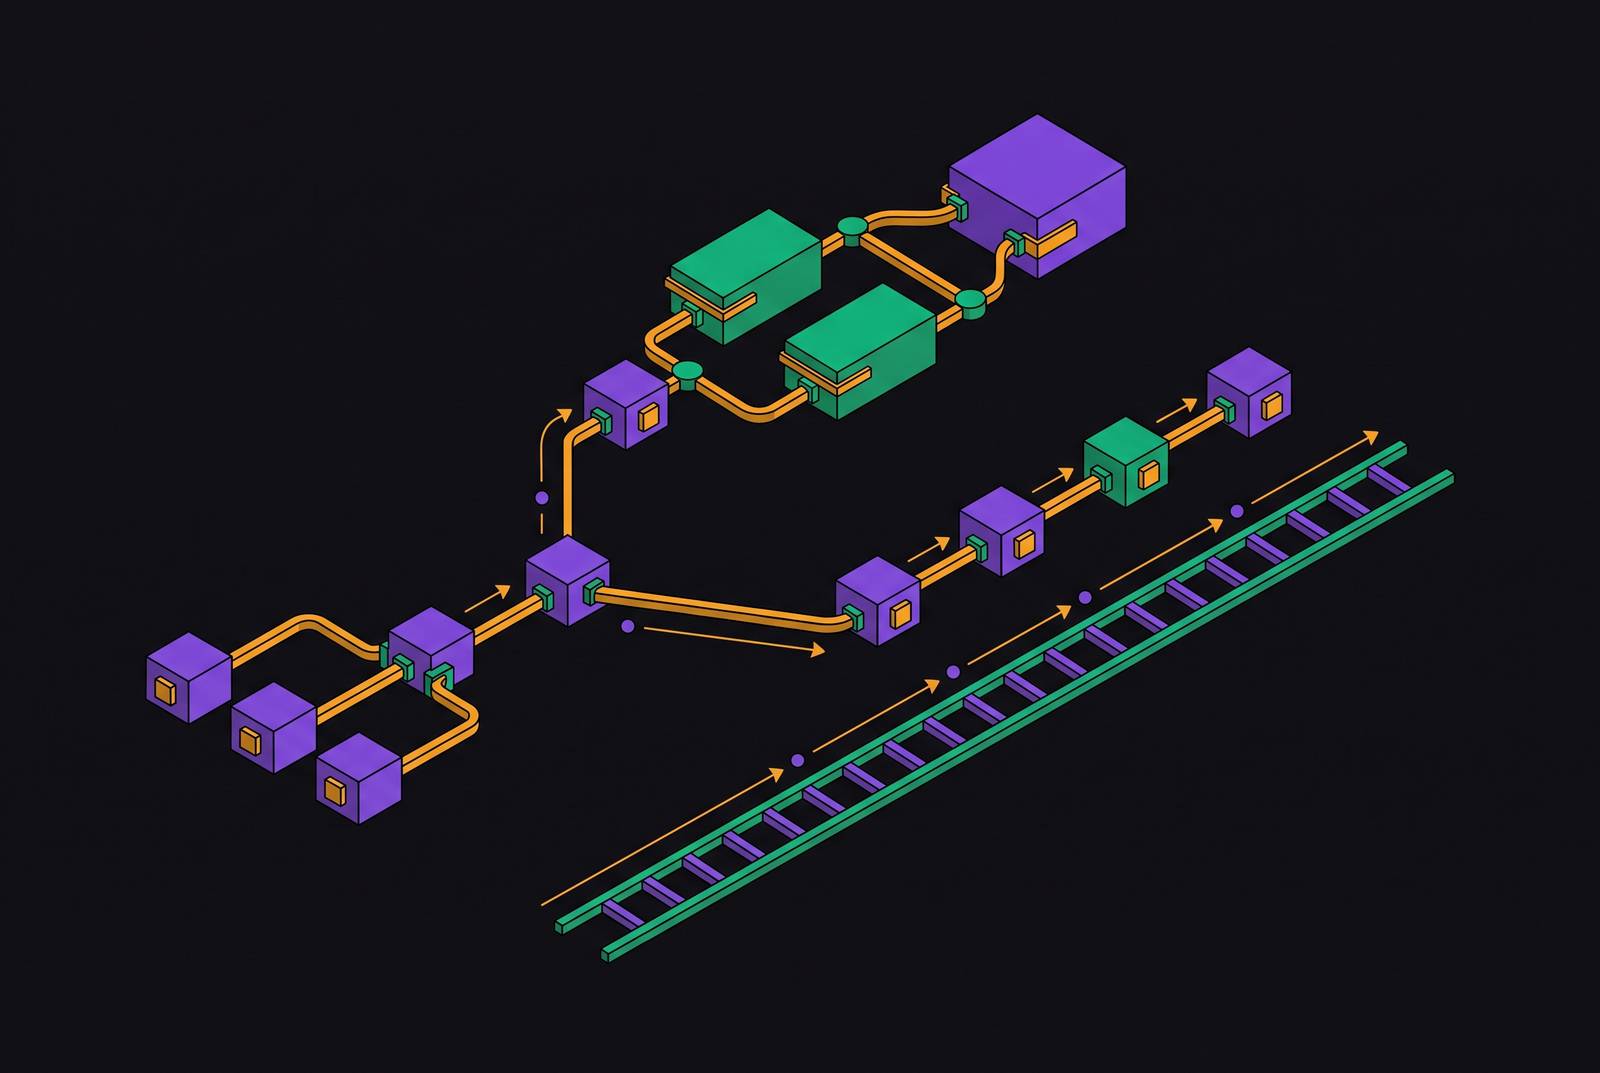
A Trace ID tags the entire lifecycle of a task, from the first prompt to the final answer, across every agent that touches it. Spans represent individual units of work: an LLM call, a tool execution, a memory read, a memory write, a sub-agent handoff, a file write. Context propagation is the mechanism that carries the Trace ID forward when Agent A delegates to Agent B. Without it, the trace splits into two disconnected fragments that share no causal link. Attributes are the metadata riding on each span: model name, temperature, token count, prompt content, tool call arguments, tool output.
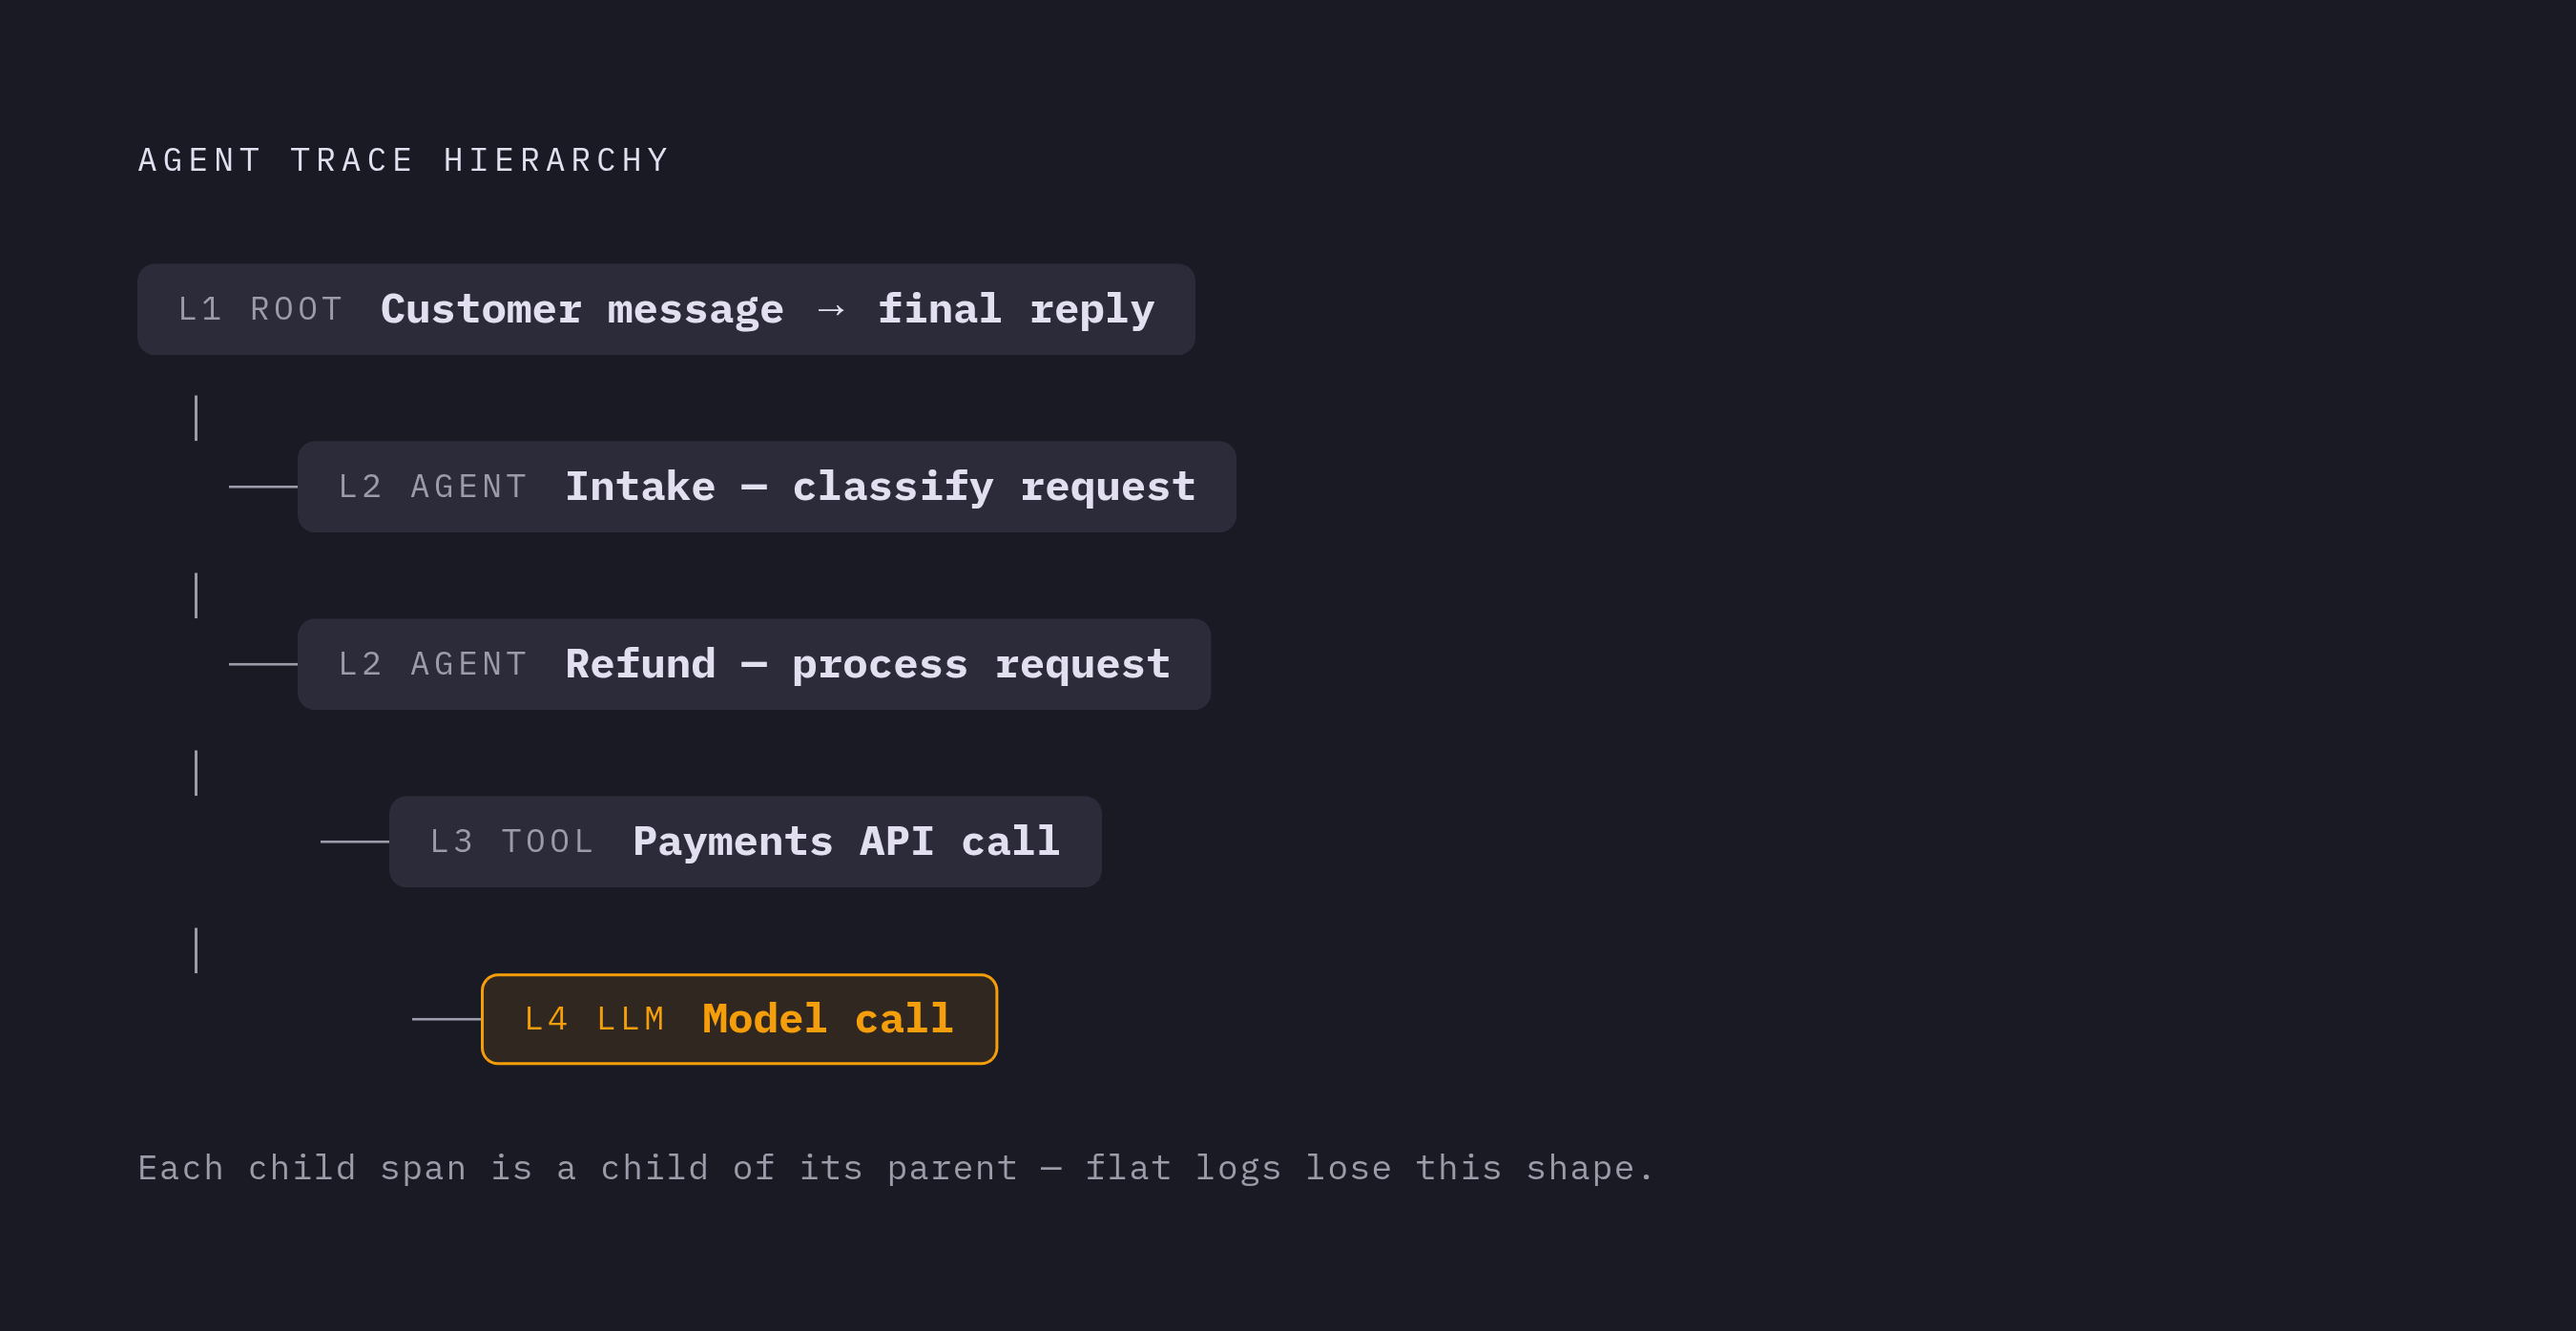
These four ideas are necessary but not sufficient. What standard OTel documentation doesn't define is the span hierarchy agents actually need. Picture a customer support agent handling a refund request. The Root Span covers the entire workflow, from the customer's message to the final reply. Beneath it sits an Agent Span for each agent's turn in the process, say, an intake agent that classifies the request, then a refund agent that processes it. A Tool Span records an external tool or API invocation. Within an agent's turn, an LLM Span captures a single model call.
Laid out this way, the trace stops being a flat list of operations. It becomes a tree that mirrors how the agent actually reasoned and acted, which is what makes root-cause analysis possible later. The OpenTelemetry GenAI SIG has been developing GenAI semantic conventions, which remain at Development, pre-stable, status as of 2026, giving teams a vendor-neutral schema for these agent-specific span types. Teams adopting them now get a vendor-neutral schema rather than a finished standard, but it's enough to sketch what an agent's own trace tree should look like before building anything.
How to instrument a multi-agent pipeline step by step
Three engineering decisions, made in order, cover the instrumentation work: set up a tracer provider, wrap agent operations in spans with the right attributes, and propagate context across every agent boundary. If you get the order wrong, or skip the third step, the whole trace tree falls apart.
Step one is initializing the tracer provider before any agent starts running. It acts as the central hub: every tracer gets created from it, and every span eventually exports from it to a backend like Jaeger, Zipkin, or a commercial platform.
from opentelemetry import trace
from opentelemetry.sdk.trace import TracerProvider
from opentelemetry.sdk.trace.export import BatchSpanProcessor
from opentelemetry.exporter.otlp.proto.grpc.trace_exporter import OTLPSpanExporter

provider = TracerProvider()
processor = BatchSpanProcessor(OTLPSpanExporter(endpoint="localhost:4317"))
provider.add_span_processor(processor)
trace.set_tracer_provider(provider)

tracer = trace.get_tracer("agent.pipeline")
Step two is creating a span for every operation that matters, including operations beneath the top-level request. LLM calls, tool invocations, memory reads, memory writes, sub-agent handoffs: each gets its own span, carrying attributes like agent name, goal, token counts, model name, and tool arguments.
with tracer.start_as_current_span("tool.execution") as span:
 span.set_attribute("agent.name", "refund_agent")
 span.set_attribute("tool.name", "check_order_status")
 span.set_attribute("tool.arguments", str(order_id))
 result = call_tool(order_id)
 span.set_attribute("tool.output", str(result))
Steps one and two are mechanical. Most engineers who've worked with OpenTelemetry before can write this code in an afternoon. Step three is where things get harder, and where most teams quietly get it wrong without realizing it until a postmortem forces the issue.
Step three is propagating context across agent boundaries. When Agent A hands a task to Agent B, whether through a message, an API call, or a shared memory store, the current trace context has to travel along with it. Agent B has to extract that context and use it as the parent for its own spans. Skip this, or get it wrong, and two completely disconnected traces result, with no causal link between them, erasing root-cause visibility for the entire downstream half of the workflow.
Context propagation across agent handoffs
Everything built in the previous section, the span hierarchy, the semantic attributes, depends on context surviving every handoff boundary. Handoffs are exactly where most agent frameworks offer the least help out of the box.
When Agent A delegates to Agent B through a message queue, an HTTP call, or shared memory, the trace context has to travel with that delegation. If the framework doesn't inject it automatically, someone has to do it by hand, packing it into message metadata or request headers. Asynchronous and event-driven handoffs, message queues, Kafka topics, are the hardest cases to get right, because the propagation step happens outside any synchronous call stack where a tracing library might otherwise catch it for free.
This matters because debugging a multi-agent failure depends on walking a specific chain: input, then plan, then retrieval, then tool arguments, then tool output, then the LLM's rewrite of that output, then the final answer. That walk only works if every handoff along the way preserved context. Break propagation at step two of that chain, and steps three through seven become orphaned spans with no parent, no causal link back to the question that started the whole thing.
Two newer protocol layers add their own propagation boundaries on top of the ones inside a single codebase. A2A, or agent-to-agent, calls introduce a second boundary: the calling agent has to pass trace context inside the A2A request envelope, and the receiving agent has to extract it and continue the trace rather than starting a fresh one. Anyone building on modern agent-to-agent protocols should treat this as a required step, not an optional one, since the alternative is a trace that silently resets at every protocol hop.
MCP tool calls introduce a third boundary with the same risk. Every one of these boundaries, message queues, A2A, is a place where a perfectly instrumented pipeline can still produce a broken trace tree, simply because context propagation wasn't handled at that specific seam.
The agent memory layer as a tracing artifact, not just application state
LLMs carry no memory between calls on their own. Any production agent that spans more than a single request needs a deliberate memory layer, or it forgets everything the instant its context window resets. That memory layer deserves to be treated as part of the trace.
Four memory tiers do different jobs, and each one needs its own representation inside the trace. In-context, or working, memory is whatever the current turn needs, worth treating the same way you'd treat RAM: fast, immediate, and gone once the turn ends. External key-value stores hold durable facts that need fast lookups. Episodic logs are the append-only record of everything that happened before, and this tier is the one that functions as the primary tracing artifact in its own right. Semantic vector memory handles retrieval of prior knowledge by meaning rather than by exact match.
Durable state, refund status, pending approvals, retry state, tool results, belongs in systems built for it: PostgreSQL, Kafka or SQS, Temporal or Durable Functions, not stuffed into the context window where it'll get silently dropped the moment the window fills up. Every read or write to those external stores needs its own span, or the causal chain breaks in a specific and dangerous way: memory operations that aren't traced become invisible steps, and the agent's reasoning appears to jump straight from question to answer with nothing showing what it actually retrieved along the way.
That invisibility isn't just a debugging inconvenience. Context window overflow is a real production failure mode, and span-level token telemetry is what catches it before the agent silently truncates its own context and starts producing degraded answers without any warning sign in the logs. Watching token counts approach a model's context limit at the span level gives a team the chance to intervene before the truncation happens, rather than diagnosing it after the fact from a confused final answer.
Bayer's use of Cognee to power scientific research workflows is a concrete case of this idea at enterprise scale: the episodic memory log maintains provenance across long-running research pipelines, functioning as an audit artifact in its own right, not merely as application state that happens to persist. The distinction between memory as audit trail and memory as convenience cache is the one to carry into how any team designs its own agent's memory layer.
What a trace must answer for debugging
A trace earns its keep only by the questions it can answer after something has gone wrong. The most common instrumentation mistake is building spans that confirm an operation happened but don't capture enough detail to explain why it went wrong.
Run through the debugging walk again, this time as a checklist for what each span needs to carry: what was the input to this step, what did the agent plan to do, what did retrieval return, what were the exact tool call arguments, what did the tool actually return, how did the LLM rewrite that output, and what reached the next agent in line. A span that logs "tool call: web_search" and stops there confirms a step occurred. It cannot explain why the next agent downstream ended up with wrong information, because the query string and the raw response never made it into the span.
Faithfulness scoring on LLM spans, checked against the retriever span feeding them, is one concrete way to catch hallucination propagation before it reaches a customer. A faithfulness threshold of 0.85 is a reasonable starting point for flagging spans where the model's output drifts materially from what retrieval actually returned. Token-level telemetry on every LLM span does similar work for cost: it enables attribution by agent, by tool, by session, and without it a looping agent can burn through an entire day's token budget before any alert fires. Latency needs the same span-level treatment. A single end-to-end p95 latency figure can't tell anyone whether the slow part is the orchestrator, one specific tool call, or the retriever, only span-by-span timing can answer that.
The Decision Evidence Maturity Model paper names the general trap here precisely: the container fallacy, the automatic assumption that having an evidence container, a trace, a log, a record, means the evidence inside it is actually sufficient. A trace doesn't answer the specific question someone needs answered during an incident just because it exists. Sufficiency has to be checked question by question, property by property, against what the trace actually captured. Before instrumenting anything, write down the three or four questions a postmortem will need answered, then check, span by span, whether the instrumentation plan actually captures the data to answer them.
Observability tooling for agents versus traditional APM backends
Wiring agent traces into a general-purpose APM backend throws away the analysis layer that agents specifically need. The tools that matter for production agents treat the session as the unit of analysis.
Standard OTel ingestion gets data into a backend. Agent-specific observability asks that backend to do more with it. Multi-turn session replay lets a team reproduce an entire workflow end to end. Online evaluation runs automated quality scoring on live traffic, using LLM-as-a-judge, programmatic checks, and statistical evaluators, configurable at the session level, the trace level, or down to a single span. Alerting needs to catch quality regressions directly, not just latency and error rate, because a new model version or a changed prompt can quietly degrade output quality while every operational metric stays green. Data curation pipelines that convert production traces into evaluation datasets make regression testing possible going forward. Cross-functional access matters too: product and QA teams need to review agent behavior directly, without having to write trace queries themselves.
Several platforms built specifically for this work were confirmed active in 2026: Maxim AI, LangSmith, Langfuse, Arize Phoenix, and Helicone. Each approaches the problem from a different angle, but they share the same starting premise: a session full of agent handoffs, tool calls, and memory operations needs to be evaluated as one connected story, not reassembled by hand from a pile of disconnected spans.