Benchmarking LLM Latency Inside Agent Tool-Call Loops
Standard LLM benchmarks miss how agent loops compound latency across multiple hops.
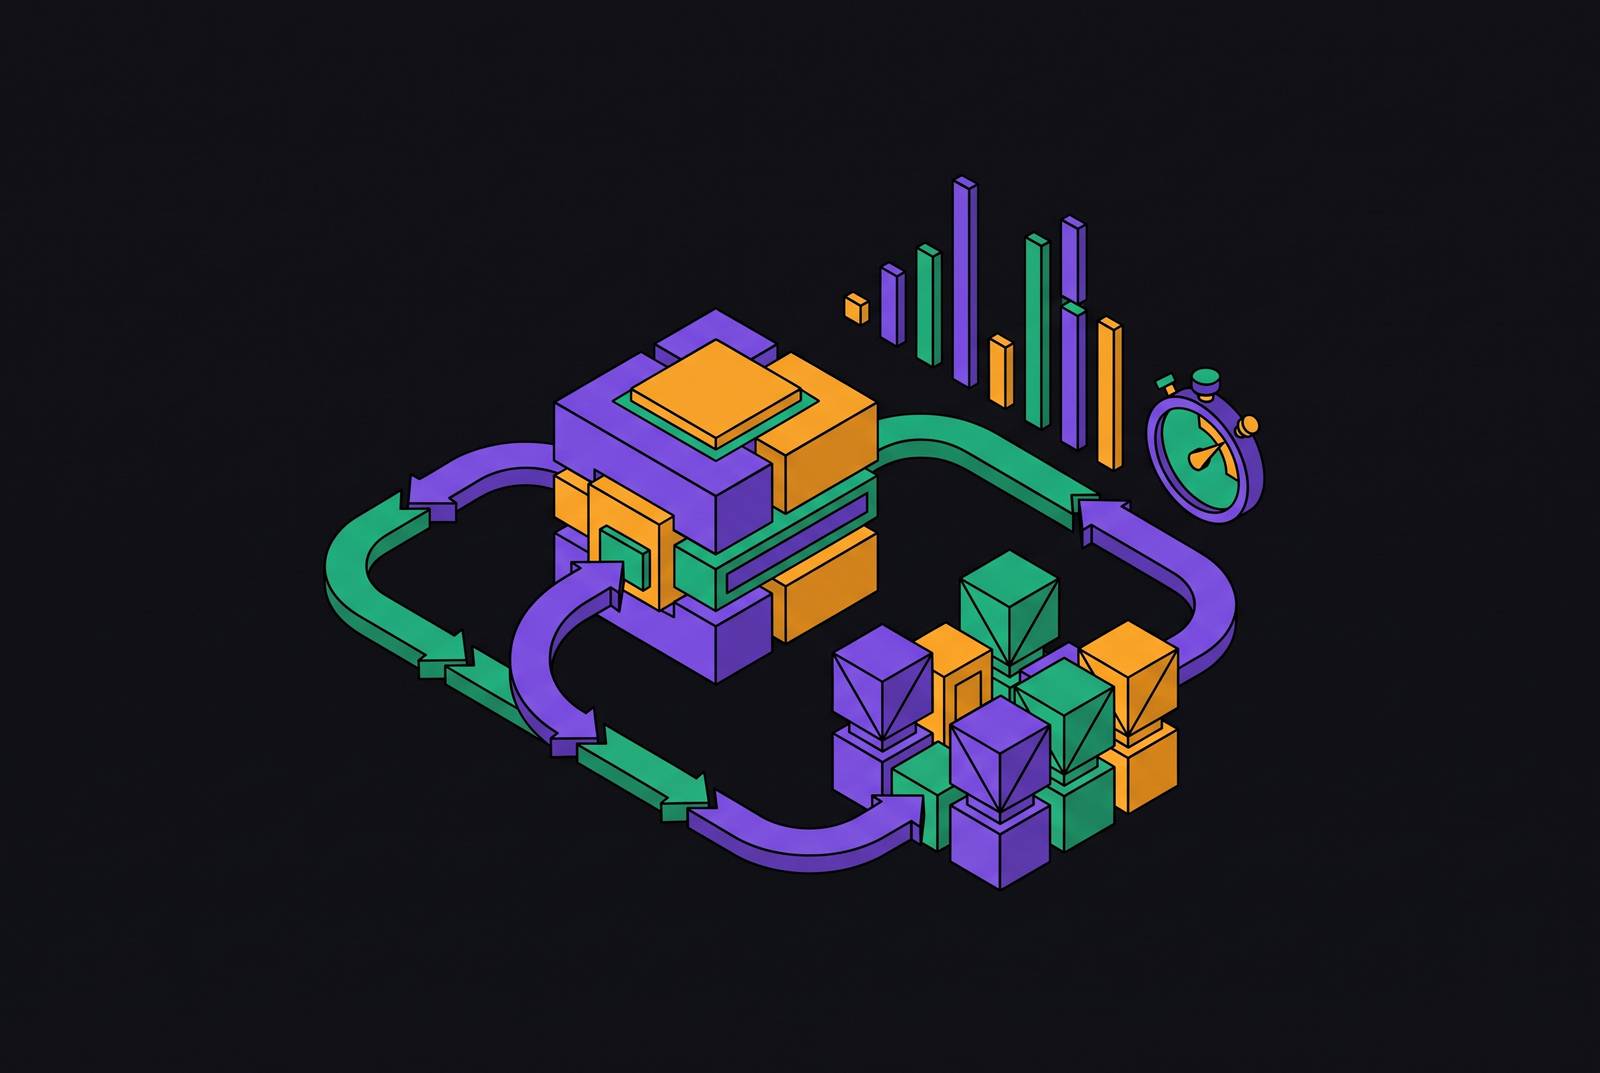
A leaderboard metric for time to first token tells you almost nothing about how long a user waits for an agent to finish a real task. TTFT measures the delay before the first token of one response, but an agent turn is rarely one response: it is a chain of LLM calls and tool calls, and the leaderboard number describes a single link while the user experiences the whole chain.
Why TTFT benchmarks don't measure what agent builders experience
A real agent turn runs through 2 to 5 LLM hops plus whatever tool calls sit between them, and each hop adds its own delay on top of the last, so total latency can compound to 3 to 10 times what a single-call API benchmark would suggest. Say you have a five-step pipeline where every step posts a fast TTFT on its own.
The mismatch runs deeper than first-token delay. Most tool-call chains don't stream partial output to the next step. The downstream consumer, whether that's another model call or the tool itself, waits for the complete output of each hop before it can start the next one. That makes throughput, tokens generated per second, often the more important number for these workloads, even though nearly every leaderboard still leads with TTFT. A model that returns its first token quickly but generates slowly can lose badly on total response time once the response runs past a few hundred tokens, because the race isn't won at the starting gun. Why would a builder optimize for a number that predicts so little about the thing they're actually shipping? One might argue leaderboards persist because TTFT is easy to measure in isolation, while total turn time requires instrumenting an entire pipeline, which is a harder (but far more honest) thing to publish.
Function-call decoding adds a cost that chat benchmarks never pay. Every tool-calling request has to carry the full tool schema in the prompt, so you pay hundreds to thousands of tokens of prefill cost on every single hop. Prefix caching can erase that repeated cost after the first call, but the benchmark prompt that produced the leaderboard's TTFT number never carried a tool schema at all, so it never paid this tax to begin with.
Latency compounding hop by hop in a tool-call loop
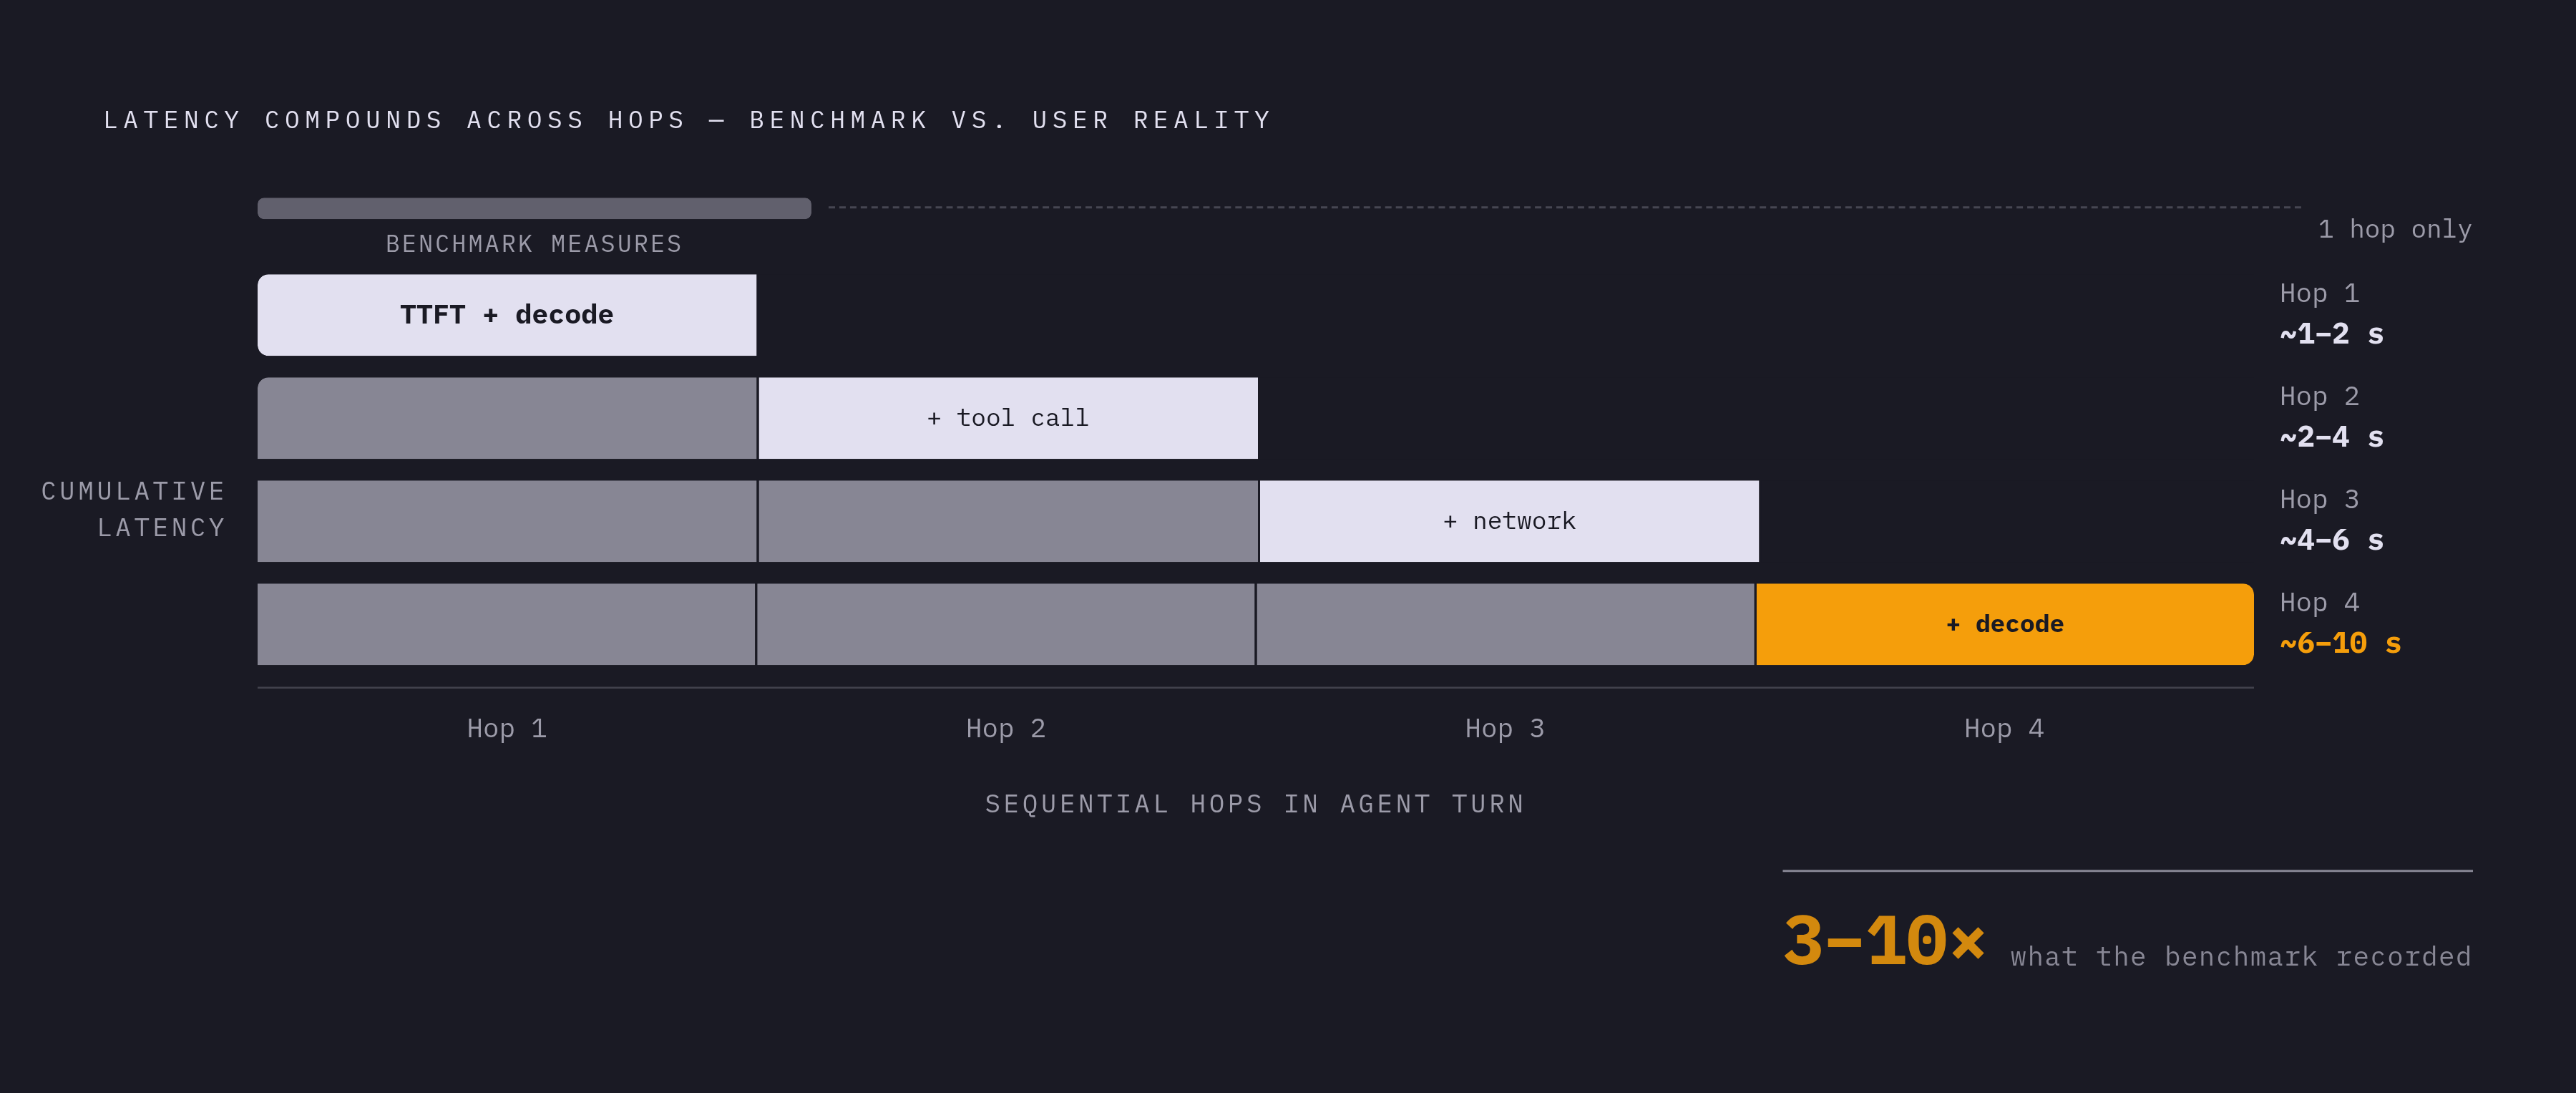
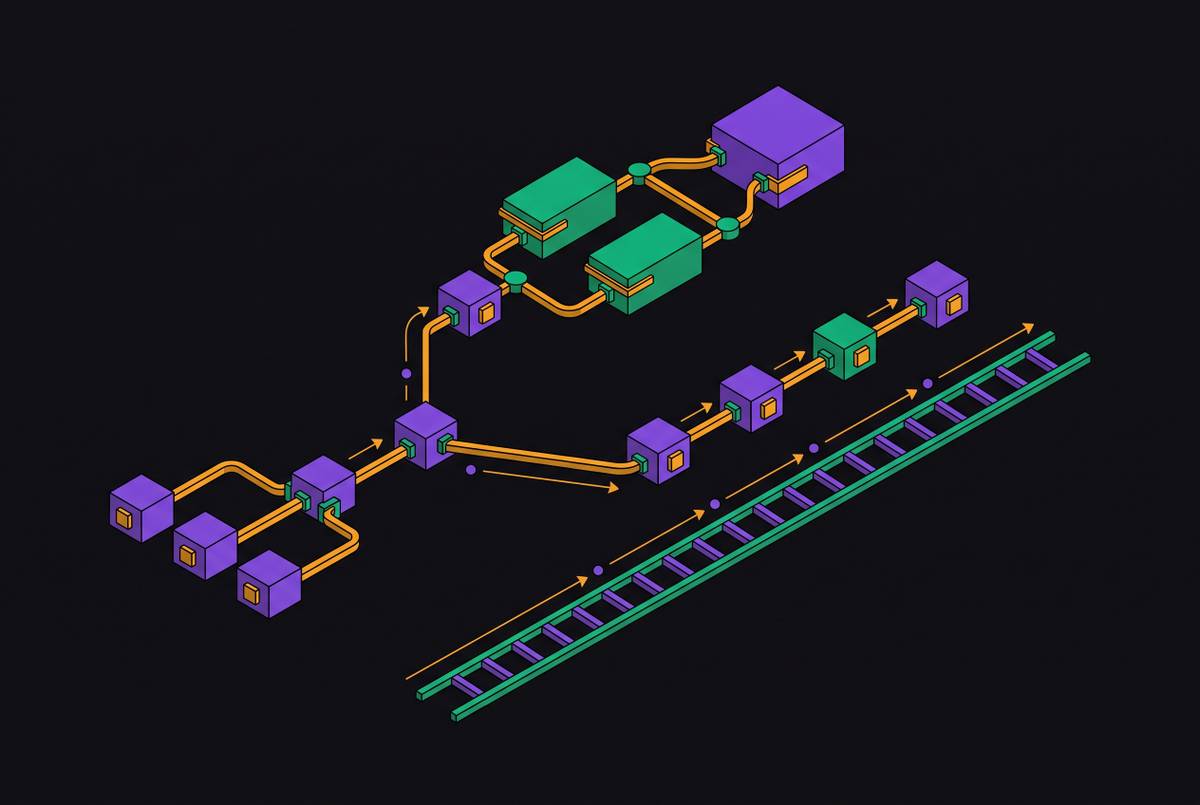
The sequential interleaving of LLM calls and tool calls is what drives the compounding, and the math behind it is multiplicative rather than additive. Each hop contributes its own TTFT, its own decode time, a network round-trip, and whatever time the tool itself takes to execute. None of that overlaps. It stacks, hop after hop, with no step able to start until the one before it finishes.
Run the numbers on a simple two-hop agent, something like an intent classifier feeding into tool calls that feed into a synthesis step, using a representative modern model: the P50 wall-clock time before any synthesized answer reaches the user already runs into multi-second territory. At a four-step pipeline, the picture worsens depending on which model sits behind each hop. At the fast end of the 2026 API landscape, four steps can already cost you several seconds in first-token latency alone. If you swap in a slower model for the same four-step pipeline, the wait climbs toward ten seconds before the agent gives you its first useful output.
Medians hide the part of this story that actually breaks trust. For most cloud LLM APIs, P99 TTFT runs two to three times the P50 figure. Tool calls that hit external services make this worse: P99 for those calls can run many times the P50. Roughly one in a hundred agent turns feels catastrophically broken to whoever is sitting in front of it. Optimizing the median while ignoring the tail is a measurement error with real consequences, because the tail is exactly where a user decides the product doesn't work.
A less visible driver sits beneath the model layer: it produces delays that look like model latency but come from scheduling decisions elsewhere in the stack. A single agentic task can send dozens of chat completion requests to the inference engine, and it can execute nearly as many tool calls. If the inference engine evicts the KV cache between turns, it forces an expensive prefill recomputation on every subsequent hop, time that looks like model latency on a trace but is really a scheduling decision made somewhere else in the stack. The ceiling causing the wait isn't compute, it's a scheduling gap elsewhere in the infrastructure, which is also why throwing more GPU at the problem doesn't fix it.
A five-step pipeline with even a fast TTFT per step burns several seconds before the user sees anything, because the benchmark number and the user's lived experience are entirely different quantities. A pipeline running at 3 to 10 times its quoted TTFT is the structural consequence of chaining sequential hops, tail-heavy external calls, and cache eviction, and it's the number builders should be estimating for their own pipelines before they trust any single-model benchmark.
Tool category's effect on the latency profile
A real agent turn involves 2–5 LLM hops plus tool calls, compounding latency by 3–10× beyond what any API benchmark suggests. Treating every tool call as an interchangeable unit of latency is where a lot of benchmarking goes wrong.
Tool calls split into categories, and each one stresses a different part of the system. Bash calls stress process execution. Read, Edit, and Grep calls stress file-system interaction. WebFetch and WebSearch calls introduce external network latency and retrieval variability that the agent has no control over. Agent and TaskOutput subtypes carry their own penalty on top of that: they tend to run both latency-heavy and token-heavy at once, which slows decode time directly and also inflates the context the next hop has to carry forward.
You can't see failure rate as a cost just by counting calls. Bash, Edit, and Read calls are more prone to failure than other categories, and failures trigger retries, adding a stochastic latency component that no single-call benchmark can ever capture, because a retry only shows up when something has already gone wrong. But what if the tools costing the most time aren't the ones failing the most? The tools that dominate total latency aren't necessarily the tools that fail most often, so builders who chase down only the failure-prone calls can leave the single biggest latency contributor completely untouched.
Where a tool runs matters as much as what kind it is. A remotely hosted MCP server can add hundreds of milliseconds to every call, and an agent that makes dozens of calls per action multiplies that penalty across the entire loop. The protocol itself is evolving to address this: the 2026-07-28 MCP revision is built stateless, which allows edge deployment and standard HTTP scaling without needing session affinity, and its formal Tasks extension now gives long-running tool calls durable, asynchronous handles, with explicit status checks through tasks/get and cooperative cancellation through tasks/cancel. Placement and protocol design are latency variables in their own right, independent of which model sits upstream.
Speed isn't the only axis that matters here. A tool call can return a perfectly valid response and still leave an agent stuck, unable to tell what to do next. If an external effect commits but the response confirming it gets lost, the agent may have no way to distinguish a committed state from an uncommitted one, forcing a stall or an unnecessary retry. An interface's latency profile depends on how much state it exposes, not just how fast it responds, because a tool being callable and a tool being operable are not the same thing. Controlled experiments from AFT-Bench found that interface mechanisms like resumable invocation and durable execution state each fully eliminate recovery failures, but only under the specific failure conditions they're designed to match, which is a strong result with a real boundary around it.
What the current benchmark stack measures
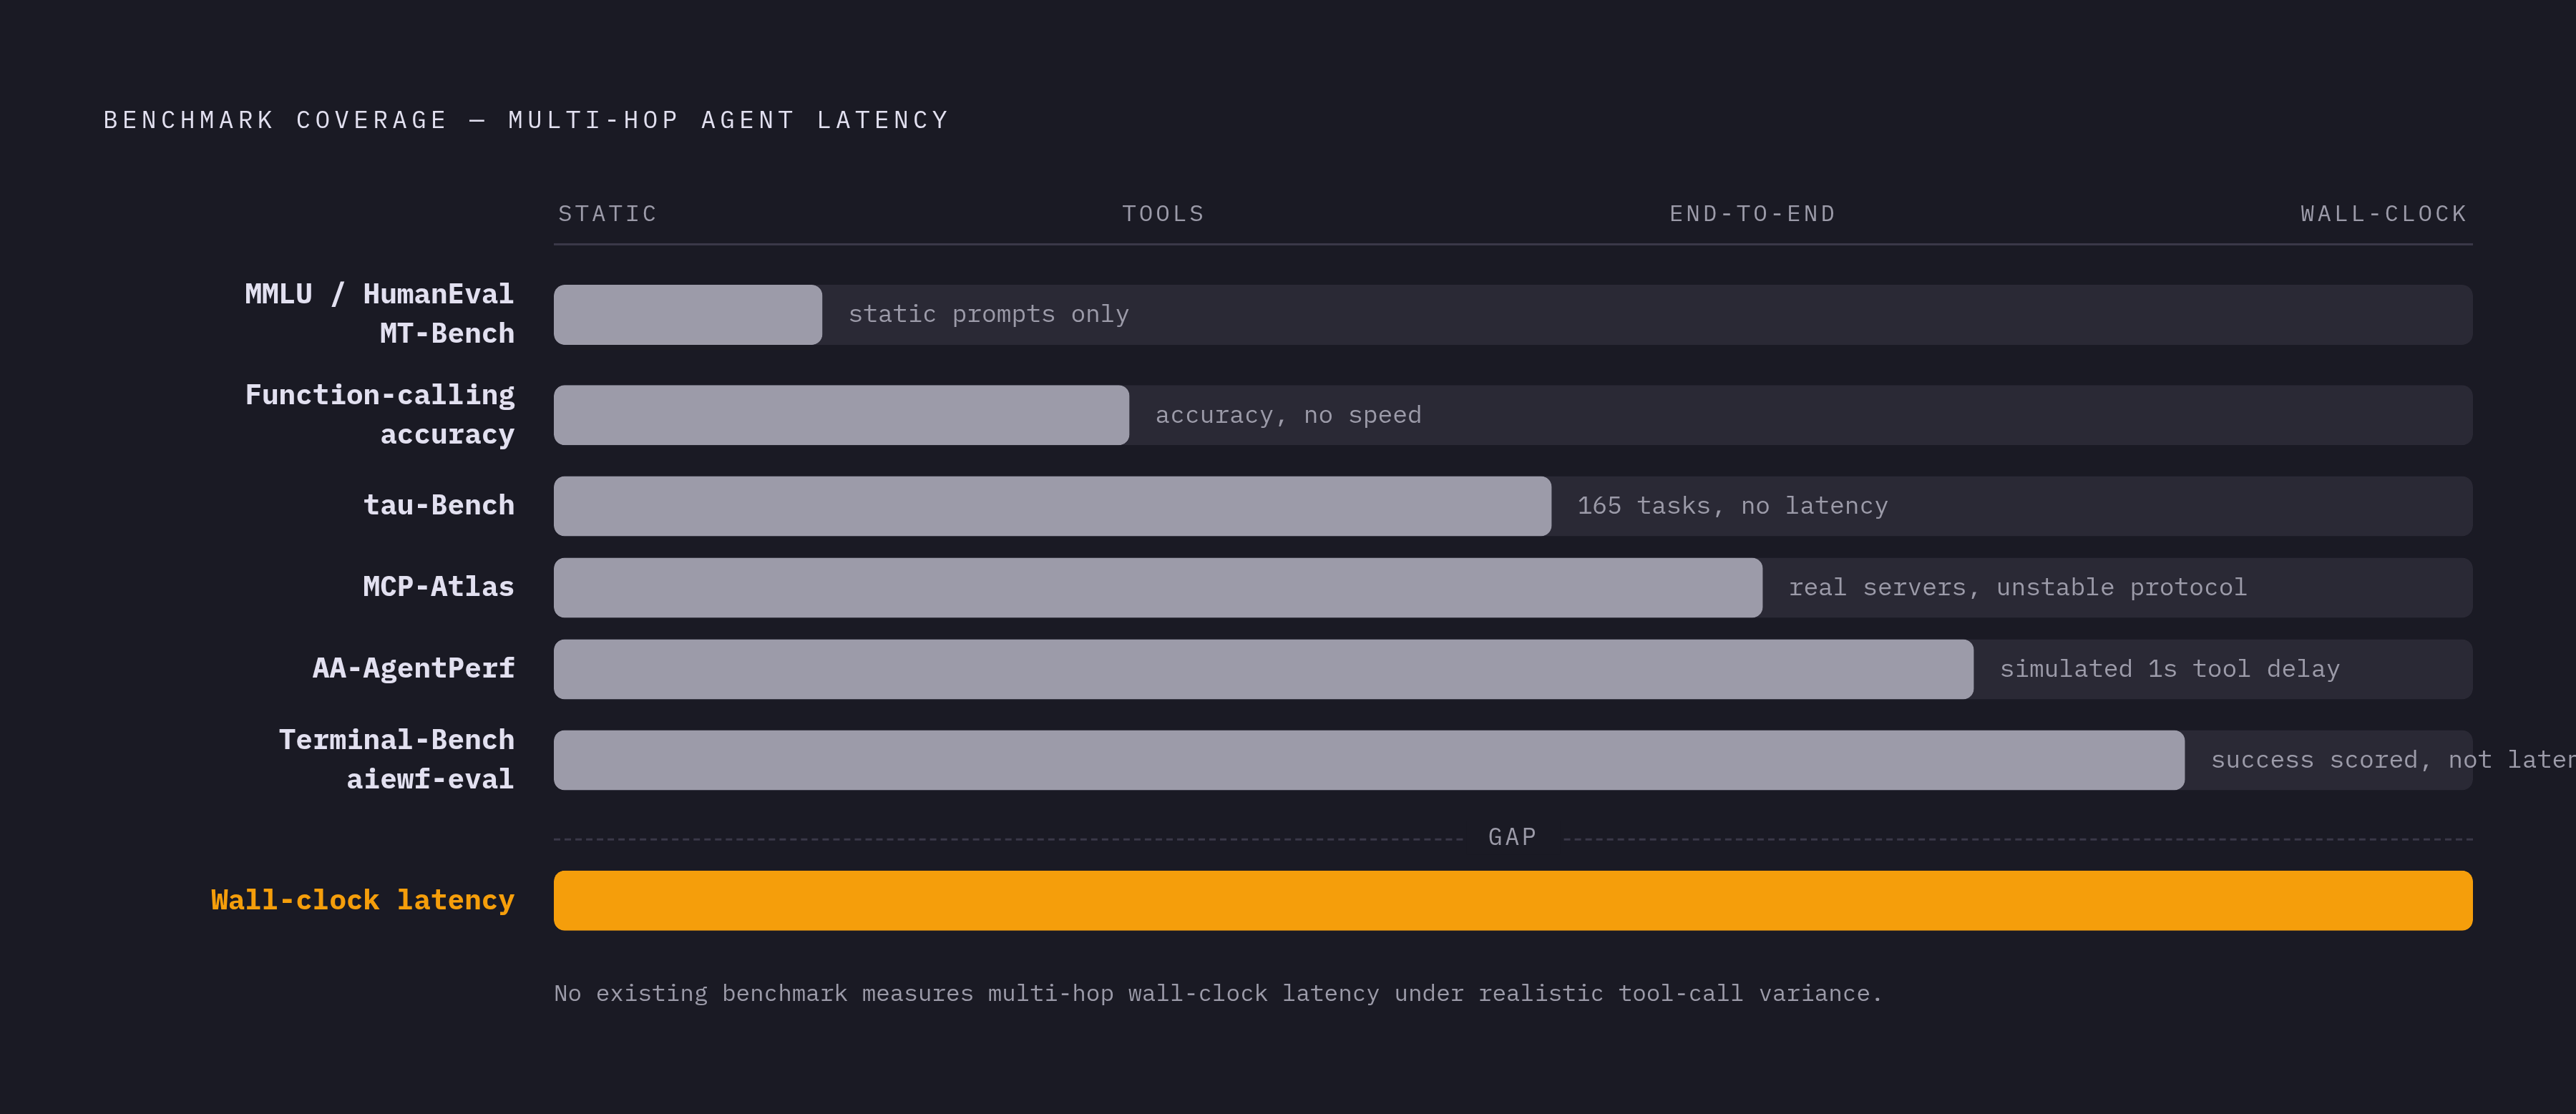
No existing benchmark was built to measure end-to-end agent loop latency. Each one covers a real slice of the problem, and a builder leaning on just one of them will have a blind spot they don't know about.
Start with the chat-oriented benchmarks: MMLU, HumanEval, MT-Bench. These carry little relevance to agent latency. They score accuracy on static prompts, with no tool calls, no sequential hops, and no latency signal anywhere in the result. MT-Bench does at least use multi-turn dialogue questions, but it still has no agentic tool use and no latency measurement built in.
Function-calling accuracy benchmarks move a step closer by scoring whether a model picks the right function and fills its parameters correctly, but accuracy still isn't speed. tau-Bench goes further by measuring end-to-end task completion across roughly 165 tasks total (115 retail, 50 airline), which adds a completion signal that pure function-selection scoring lacks. Even tau-Bench, though, reports no latency dimension at all.
MCP-Atlas attempts to score models against real MCP servers, which is closer to the conditions this piece has been describing, but its own history shows how unstable a benchmark tied to a moving protocol can be. Its April 2026 update replaced a 20-turn limit with a 100 tool-call budget and re-scored every model under the new rule, so rankings built on a changing protocol don't hold still, and you can't reliably compare results across benchmark versions.
Artificial Analysis brought a different lens entirely with AA-AgentPerf, and it's the first benchmark focused on GPU performance inside agentic coding loops. It measures concurrent agent capacity across pre-recorded coding trajectories that interleave reasoning and tool use, and it simulates inter-turn latency by mapping tool calls to representative CPU tasks with a one-second median simulated delay. You get a genuinely useful hardware-performance view that pure API benchmarks don't offer, but because the delay is simulated, it can't show you how much real external tool calls actually vary in practice.
Terminal-Bench, presented at ICLR 2026, tests agents on hard, realistic command-line tasks, exactly the kind of workload where compounding latency does the most damage: code changes, incident investigation, internal tooling. But its scoring focuses on task success, not on the latency profile of the trajectory that got there.
Voice agents get the sharpest version of this tradeoff. Daily.co released an open-source benchmark called aiewf-eval in February 2026 that tests latency, tool calling, instruction following, and knowledge grounding across long, multi-turn conversations, and its results lay out the accuracy-versus-latency tension: the models scoring highest on capability are currently too slow to hit the sub-700ms TTFT that natural voice conversation demands. As of the benchmark's publication, most production voice agents run on GPT-4.1 or Gemini 2.5 Flash. Teams are choosing a capability score below the theoretical ceiling in exchange for latency that won't break the conversation.
Lined up, these benchmarks leave behind the same gap every section so far has been circling: real-world, multi-hop, wall-clock latency under realistic tool-call mixes. Every benchmark above measures something true. None of them measures that.
A measurement framework built for multi-hop agent loops
Closing that gap means instrumenting the full hop-by-hop trace, not just the model's API response, and building a framework that separates signals by use case, time horizon, and failure mode.
Start by tracking two clocks separately, because they respond to different levers entirely. TTFT per hop tells you how fast each individual LLM call returns its first token. That number drives perceived interactivity in a streaming interface and improves with prompt caching, smaller input contexts, and faster models. Total turn time measures wall-clock time from the user's input to the agent's complete response, folding in every LLM hop, every tool execution, every network round-trip, and any retry overhead along the way. That number improves through parallelizing tool calls that don't depend on each other, cutting the number of LLM hops in the pipeline, and choosing models with higher throughput rather than just a faster start. Collapse these two clocks into one metric and the result is an optimization that makes the benchmark number look better without making the user's actual experience any faster.
Neither clock means anything without a latency budget matched to the use case, because "is this agent fast enough" has no answer until you specify what it's for. A six-tier latency budget framework is a useful starting point here because it forces the question of use case before the question of speed. Voice and real-time agents are at the tightest end: a hard voice-to-voice response ceiling translates into a narrow TTFT budget for the text-mode LLM sitting inside a transcription-to-LLM-to-voice harness, a constraint tight enough to rule out the highest-accuracy models entirely. Interactive coding or investigation assistants can tolerate several seconds of total turn time before the experience starts to feel broken. Batch and background pipelines, scheduled jobs, overnight data analysis, can absorb minutes, which shifts the whole optimization priority away from speed and toward throughput and cost.
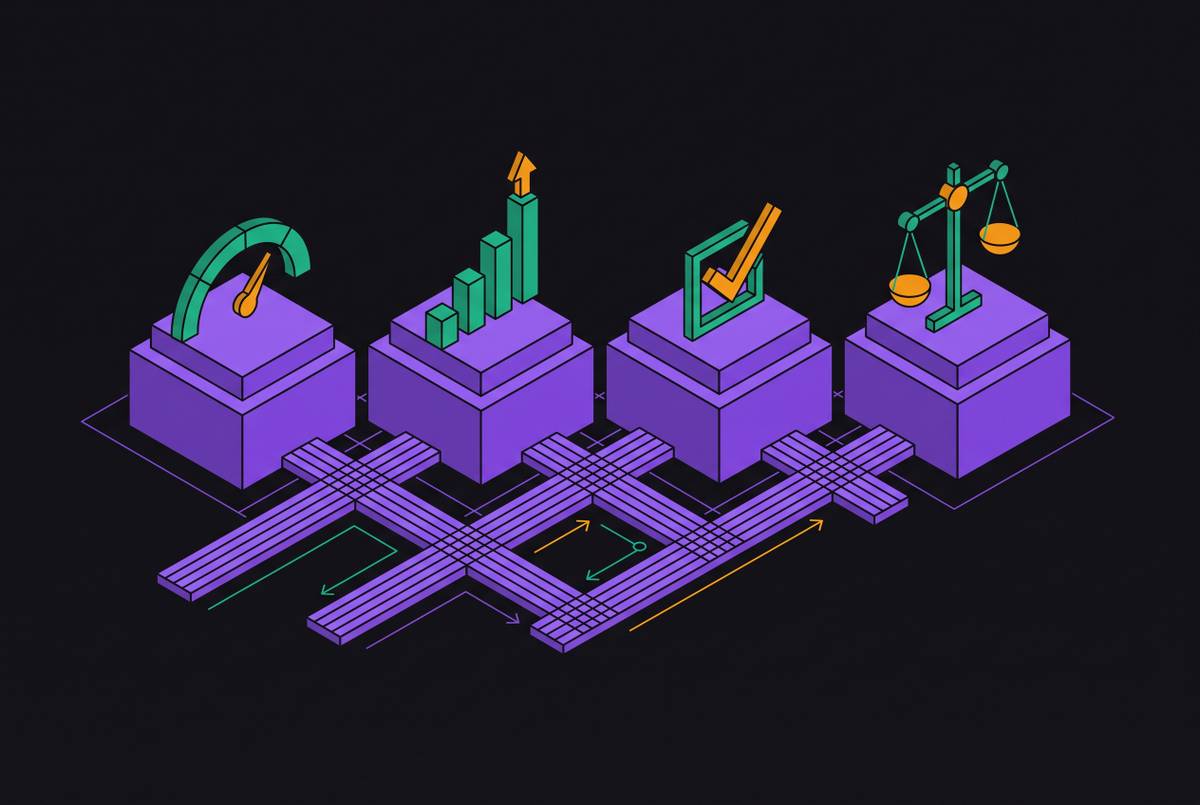
Once the budget is set, production monitoring should watch two signals above all else: P99 latency and turn-budget hit rate, because the median hides exactly the failures that matter. Alert thresholds should be set on both; when they spike together, the cause is almost always a prompt regression or a newly introduced tool with an unusually high failure rate. A low median paired with a high P99 describes an agent that works most of the time and breaks in ways invisible until a user hits the broken path and reports it.
The hierarchical trace, not the raw API response, is the right unit to capture all of this. A trace worth keeping records the reasoning steps, which tools were considered, which were actually invoked, what arguments they were passed, what came back, how many tokens each step spent, and the latency of every hop, stitched together into something that can be replayed end to end. Evaluating only the final answer tells you that something broke somewhere in the chain. It doesn't tell you where. That's why evaluation needs three levels at once: end-to-end, asking whether the task succeeded; trajectory-level, asking whether the path taken was efficient; and component-level, asking which specific tool, retriever, or sub-agent introduced the latency spike that slowed everything else down.
None of the benchmarks surveyed here were built to answer all three questions at once. That's the actual work in front of agent builders now: not waiting for a single leaderboard number to capture it, but instrumenting the loop itself, hop by hop, until the trace tells the same story the user is living through.
Sources
- Callability Is Not Operability: Controlled Interface Interventions for LLM Agents
- AI Agent Tool Calling Benchmarks on GPU Cloud: BFCL v4, tau-Bench, and Function-Call Latency Optimization (2026 Guide) | Spheron Blog
- Benchmarking LLMs for Voice Agent Use Cases - Daily.co
- AI Agent Latency Budgets: 6-Tier Framework [2026]
- LLM Latency Benchmarks 2026: 6 Levers for Sub-500ms TTFT