Detecting Agent Failure Modes in Production Observability Stacks
Agents fail invisibly—confidence with wrong answers—and standard monitoring can't catch it.
Agents don't fail the way normal software fails. A web service throws a server error, an engineer gets paged, someone checks a stack trace. An agent can complete a task, return a clean 200, and still hand a customer the wrong answer with total confidence. This piece is about what it actually takes to catch that, and why most observability stacks built for the last decade of software can't.
In one documented case, an agent told customers their orders had shipped when they had not, in roughly 3 to 4% of conversations. Error rate: zero. Latency: normal. Every health check green. The actual cause took extensive log-grepping to find: a tool call was silently returning cached data from a stale connection pool, and the agent had no way to know the data wasn't fresh. There was no exception. No warning. Nobody had built a trace that would have caught it, so there was none. That's the gap this piece works through.
The failure modes that are unique to agents and invisible to standard monitoring
Traditional APM assumes deterministic behavior: same input, same output, known code paths, and an HTTP error code you can trust as a failure signal. Agents violate all three assumptions at once. The same prompt can trigger different tool calls depending on what the model decides in the moment, the execution path isn't written in code but chosen at runtime by the model itself, and a 200 status can wrap an answer that's confidently, completely wrong. None of the old signals apply cleanly.
Multiple failure patterns appear in agentic systems that either don't exist in traditional software or get dramatically worse once an LLM is making the decisions.
Tool misuse and call failures sit at the center of most incidents. An agent can pick the wrong tool, pass the wrong arguments, or receive a truncated, empty response wrapped in a 200 and simply treat it as complete. Because agent steps chain together, one malformed argument at step two can quietly corrupt every step downstream, and nothing in a standard dashboard flags it, because nothing technically errored.
Context loss across turns is a second pattern, and it's well documented outside the agent-monitoring literature specifically. As a conversation grows, context window pressure pushes earlier constraints out of scope, retrieval in memory-augmented agents can miss the right entry, and the agent tends to over-weight whatever came most recently. Research on long-context and multi-turn performance has found meaningful accuracy degradation as conversations extend, with some studies showing average drops near 39% across models, and are consistent across studies examining where in a long input the relevant information appears. There isn't a clean, universally cited threshold tying degradation to a specific turn count, but the direction of the effect is consistent across the research.
Goal drift is subtler still. No individual step fails outright, but small reasoning deviations accumulate turn over turn until the agent is solving a slightly different problem than the one the user asked about. Because every single step looks locally reasonable, per-turn evaluation misses the accumulated drift. It's an emergent failure, visible only when you look at the whole trajectory.
Retry loops follow a similar shape: the agent calls the same tool repeatedly without changing its approach. Each individual call might look fine in isolation. Only the pattern across calls gives it away.
Cascading errors in multi-agent systems are worse again, because now the failure is propagating between agents that each depend on the last one's output. The downstream effects are visible: a wrong answer, a bad handoff. But the root cause, buried three agents upstream, is not, and current research treats this as the field's central unsolved problem (more on that below).
Silent quality degradation rounds out the list: output quality slides downward gradually, with no error code anywhere in the pipeline, completely invisible to anything watching error rates.
A 2026 production study (arXiv:2605.01604) formalizes this into a seven-category taxonomy: cascading decision errors, silent tool degradation, distribution collapse, cross-surface inconsistency, explanation decoupling, latency-driven correctness erosion, and proxy goal convergence. Each category names a place where standard metrics either fail to detect failures entirely or only surface them after a significant lag.
A prompt change or a model version bump can double token usage overnight, and the first sign is often the invoice, not a dashboard, so cost blowout is a practical failure mode that rarely makes it into correctness-focused taxonomies. A prompt change or a model version bump can double token usage overnight, and the first sign is often the invoice, not a dashboard. Cost tracking belongs in agent monitoring from day one, not bolted on after the first bill shock.
What agent observability captures that traditional APM does not
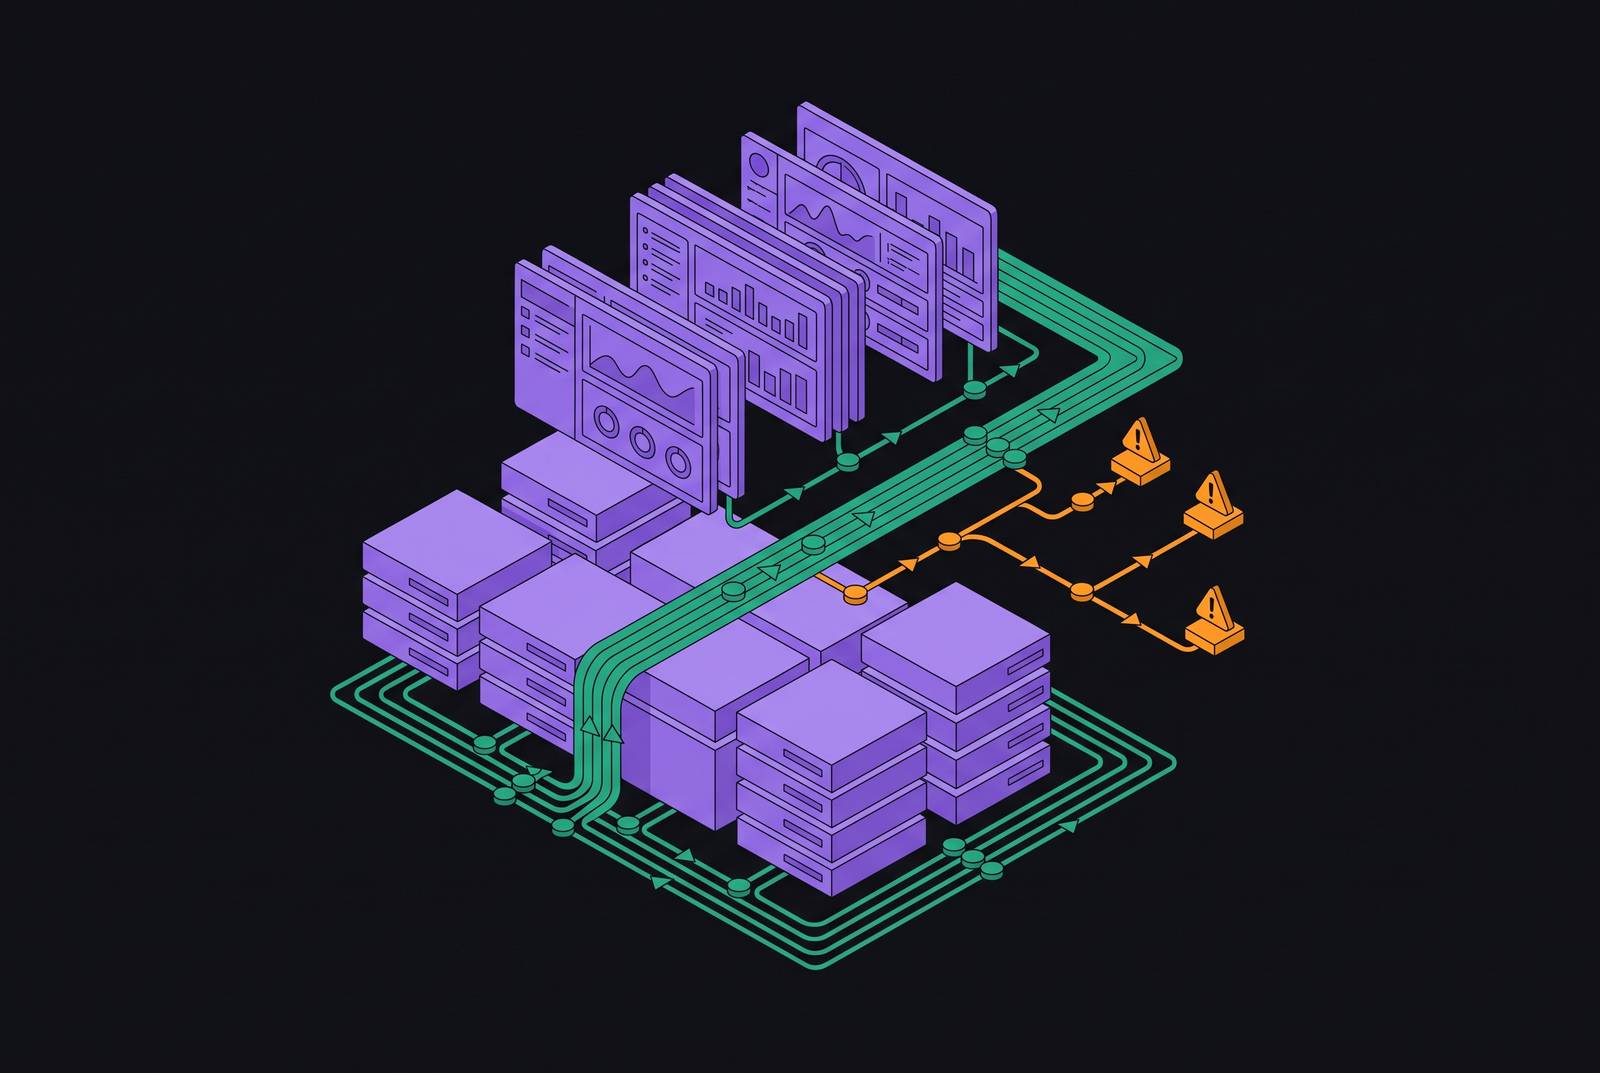
Agent observability, as a discipline, means capturing every step an agent takes: which tool it picked, what arguments it passed, what the model actually said at each turn, what it read from and wrote to memory, and which decision branch it took instead of the others available. The output is a structured trace that lets an engineer reconstruct, after the fact, what happened, in what order, with what inputs and what outputs at each step.
It borrows the three classic pillars of observability, traces, metrics, and logs, but adapts all three for a system where control flow is chosen by a language model at runtime rather than written by an engineer ahead of time. Instrumenting an agent means instrumenting decisions, not just function calls, so traces have to capture the reasoning that led to an action rather than just the action itself.
Four span types make up the minimum viable trace schema for an agent. Tool-call spans record the tool name, the arguments passed, the raw output, duration, retry count, and error state, without which hallucinated arguments and silent retries look exactly like normal traffic. Reasoning spans capture the model's plan, the action it picked, the observation it made from that action, and what it decided to do next, surfacing plan drift and wrong-branch selection in a way a single LLM call span never could. State transition spans record how working memory and context change across steps, which is how context loss and summarization drift get caught before they quietly degrade a long-running session. Memory operation spans log reads and writes to long-term storage so that data-freshness problems and retrieval gaps that silent tool failures can otherwise hide become visible in the trace.
Every span carries timestamps and parent-child links, so a single trace can reconstruct the full execution graph behind one user request, from the first prompt to the final answer.
OpenTelemetry's GenAI semantic conventions give agents a shared instrumentation language
Before late 2025, every observability vendor built its own schema for agent telemetry. There was no shared vocabulary across frameworks or backends, which meant a trace captured in one tool couldn't be read cleanly in another, and teams switching platforms had to rebuild instrumentation from scratch.
That changed with OpenTelemetry's GenAI semantic conventions, which had seen broad adoption by 2026. The conventions define standard attribute names, span kinds, and event structures built specifically for generative AI workloads. A span produced by one framework can be read and understood by any backend that speaks OTel.
At the center is a shared gen_ai.operation.name enum covering operations like chat, create_agent, invoke_agent, invoke_workflow, plan, execute_tool, embeddings, and retrieval. An engineer reading a trace can now tell a planning step apart from a tool call or a sub-agent invocation without knowing which framework generated it. Alongside that, standard per-span attributes like gen_ai.request.model, gen_ai.usage.input_tokens, gen_ai.usage.output_tokens, and gen_ai.response.finish_reasons give every span a common set of fields to report token usage and how a generation ended. Spans can also carry attributes capturing the actual input and output content exchanged during a generation.
Auto-instrumentation already exists for a couple of major model providers' interfaces, and for retrieval-oriented frameworks, so each tool call, model invocation, and retrieval step becomes its own child span without an engineer writing manual instrumentation for it. The result is a full reasoning-chain trace that's portable across tools, which is the entire point.
Failure attribution in multi-agent systems is an unsolved research problem
Once a multi-agent workflow produces a wrong outcome, the next question is obvious: which agent caused it, and at what step? That question, called failure attribution, is now its own subfield of research, and it remains largely unsolved.
2026 research frames the goal as finding the "decisive error", the earliest mistake in the trajectory whose correction would have reversed the eventual failure. That's a harder target than it sounds. Current approaches to failure attribution remain limited in accuracy, and the low benchmark scores reflect how difficult it is to isolate the root cause from a full execution trajectory.
The accuracy numbers make the scale of the problem clear. On one benchmark, the best existing methods for locating the critical error step reach only 17.1% accuracy. On the more demanding TRAIL benchmark, top models manage joint accuracy as low as 18.3%. Those numbers describe what researchers call the attribution gap: existing methods aren't close enough to production-ready to be patched, they need a fundamentally different approach.
How current production observability platforms divide the problem space
Agent observability is a young discipline, and the platform landscape is still settling into shape because vendors are still converging on shared conventions and practices. As agentic AI moves from pilots to production, questions of governance, safety, and auditability make the choice of observability platform a genuinely high-stakes decision.
The Confident AI 2026 comparison lays out how the major platforms currently divide the work. Confident AI positions itself around a complete quality loop: full trace visibility, evaluations run on every step, research-backed metrics from DeepEval, human feedback loops, anomaly detection, and a pipeline that turns traces back into evaluation datasets. Its free tier includes 1 GB of processed data and 10,000 evaluation scores, and the comparison names it the strongest option for teams that need both step-level and trace-level scoring rather than a viewer that just shows what happened.
Langfuse is positioned as the strongest choice for teams that want to self-host, pairing open-source LLM tracing with an evaluation layer on top. Monte Carlo fits teams that need to trace agent failures back to problems in the upstream data pipelines feeding the agent, a narrower job than a full evaluation-first quality loop, but a critical one where the failure originates in bad data rather than bad reasoning. Arize Phoenix is open-source and appears frequently in comparisons of agent observability tooling as a widely used baseline option.
MLflow is OTel-compatible and exposes an OTLP endpoint at /v1/traces that automatically recognizes GenAI semantic-convention traces, along with traces coming from frameworks like Google ADK, LiveKit Agents, and Spring AI. For teams already living inside the MLflow ecosystem, it's the natural fit.
Amazon Bedrock AgentCore Observability gives visibility across three layers at once: metrics, traces, and structured logs. It emits distributed traces and span-level logs, along with metrics reported under the bedrock-agentcore CloudWatch namespace, following the OTel protocol, and the same telemetry can be exported to Datadog, Grafana Cloud, or Elastic without extra instrumentation work. The comparison lands on a clear minimum bar for production: operational metrics, application logs, distributed traces, and quality evaluations, all four together, not any one in isolation.
Datadog was among the first commercial platforms to natively support OTel v1.37+'s GenAI semantic conventions, and Elastic serves as one of the backends able to receive Bedrock AgentCore telemetry directly.
Across all of them, one dividing line matters more than any other. Full trace visibility is table stakes at this point, nearly every platform on this list offers it. The stronger platforms also score what they capture. A tool that only shows you the trace is useful for debugging a single bad run after the fact. A tool that scores every step and every trace can tell you, across thousands of production runs, whether quality is holding up.
The instrumentation patterns that work across mixed framework stacks
Most production agent systems aren't built on one framework end to end. A team might run an orchestration layer, a retrieval component, and a couple of specialized sub-agents, each with its own SDK and its own default logging behavior. The instrumentation that actually holds up under that kind of mix shares a few properties.
It standardizes on the OTel GenAI semantic conventions at the boundary, regardless of what's producing the span underneath. That's precisely what the conventions were built to solve: a gen_ai.operation.name of execute_tool means the same thing whether it came from an orchestration framework or a hand-rolled agent loop, and a backend built around that vocabulary doesn't need custom parsing logic per framework.
It also treats the core span types covering tool calls, reasoning steps, state transitions, and memory operations as non-negotiable, even when a framework's default instrumentation only gives you one or two of them out of the box. Filling that gap is usually a matter of wrapping tool calls and memory operations manually to emit the missing spans, rather than accepting a partial trace and hoping the gaps don't matter.
Parent-child span linkage across framework boundaries is easiest to lose and hardest to recover once it's gone. When a sub-agent built on one framework hands off to an orchestrator built on another, the trace has to carry a consistent trace ID and parent span ID across that handoff, or the resulting picture fractures into two traces that look unrelated even though they belong to the same user request.
And cost and token metrics need to travel with every span from the start, not get added after a billing surprise forces the issue. Given how easily a prompt change or model upgrade can double token usage overnight, treating gen_ai.usage.input_tokens and gen_ai.usage.output_tokens as first-class fields, not afterthoughts, is one of the cheapest things a team can do early, and one of the most expensive things to skip.
Sources
- Agentic AI Observability: A 2026 Playbook
- Agent observability: The complete guide for 2026 - Articles - Braintrust
- Top 8 AI Agent Observability Platforms for 2026 - Confident AI
- Evaluating Agentic AI in the Wild: Failure Modes, Drift Patterns, and a Production Evaluation Framework
- mlflow.org
- opentelemetry.io